Continuing my blog articles on spectral indices "Spectral Indices with multispectral satellite data" and "Spectral Indices in Remote Sensing and how to interpret them", here I make a quick comparison between two very important spectral indices: SAVI (Soil Adjusted Vegetation Index) and NDVI (Normalized Difference Vegetation Index)
SAVI or Soil Adjusted Vegetation Index is a spectral index introduced by Huete in 1988.
SAVI attempts to be a hybrid between the ratio-based indices and the perpendicular indices. The reasoning behind this index acknowledges that the isovegetation lines are not parallel, and that they do not all converge at a single point.
SAVI can be calculated based on the following equation:
SAVI = (1 + L) * (Bnir - Bred) / (Bnir + Bred + L)
where L is a correction factor which ranges from 0 for very high vegetation cover to 1 for very low vegetation cover. The most typically used value is 0.5 which is for intermediate vegetation cover. Bnir and Bred are the band values of the nir and red band. Of course it is assumed that these values are in the same scale. In general when calculating any spectral index atmospherically corrected reflectance values should be used.
Now let's consider the well known NDVI (Normalised Difference Vegetation Index). It is calculated using the following question:
NDVI = (Bnir - Bred) / (Bnir + Bred)
As you may notice, the spectral bands used are the same and in a very similar way. Both indices use these bands in a normalised difference.
NDVI is very useful because it only needs the spectral measurements from the satellite, i.e. we only need the image pixels. On the other hand SAVI needs the L parameter, which is quite difficult to estimate accurately.
The reason is that not all soils are alike. Different soils have different reflectance spectra, due to many factors (soil moisture, organic content, mechanical composition, ferrous content, etc). All of the vegetation indices assume that there is a soil line, where there is a single slope in RED-NIR space. However, it is often the case that there are soils with different RED-NIR slopes in a single image. Also, if the assumption about the isovegetation lines (parallel or intercepting at the origin) is not exactly right, changes in soil moisture (which move along isovegetation lines) will give incorrect answers for the vegetation index. The problem of soil noise is most acute when vegetation cover is low.
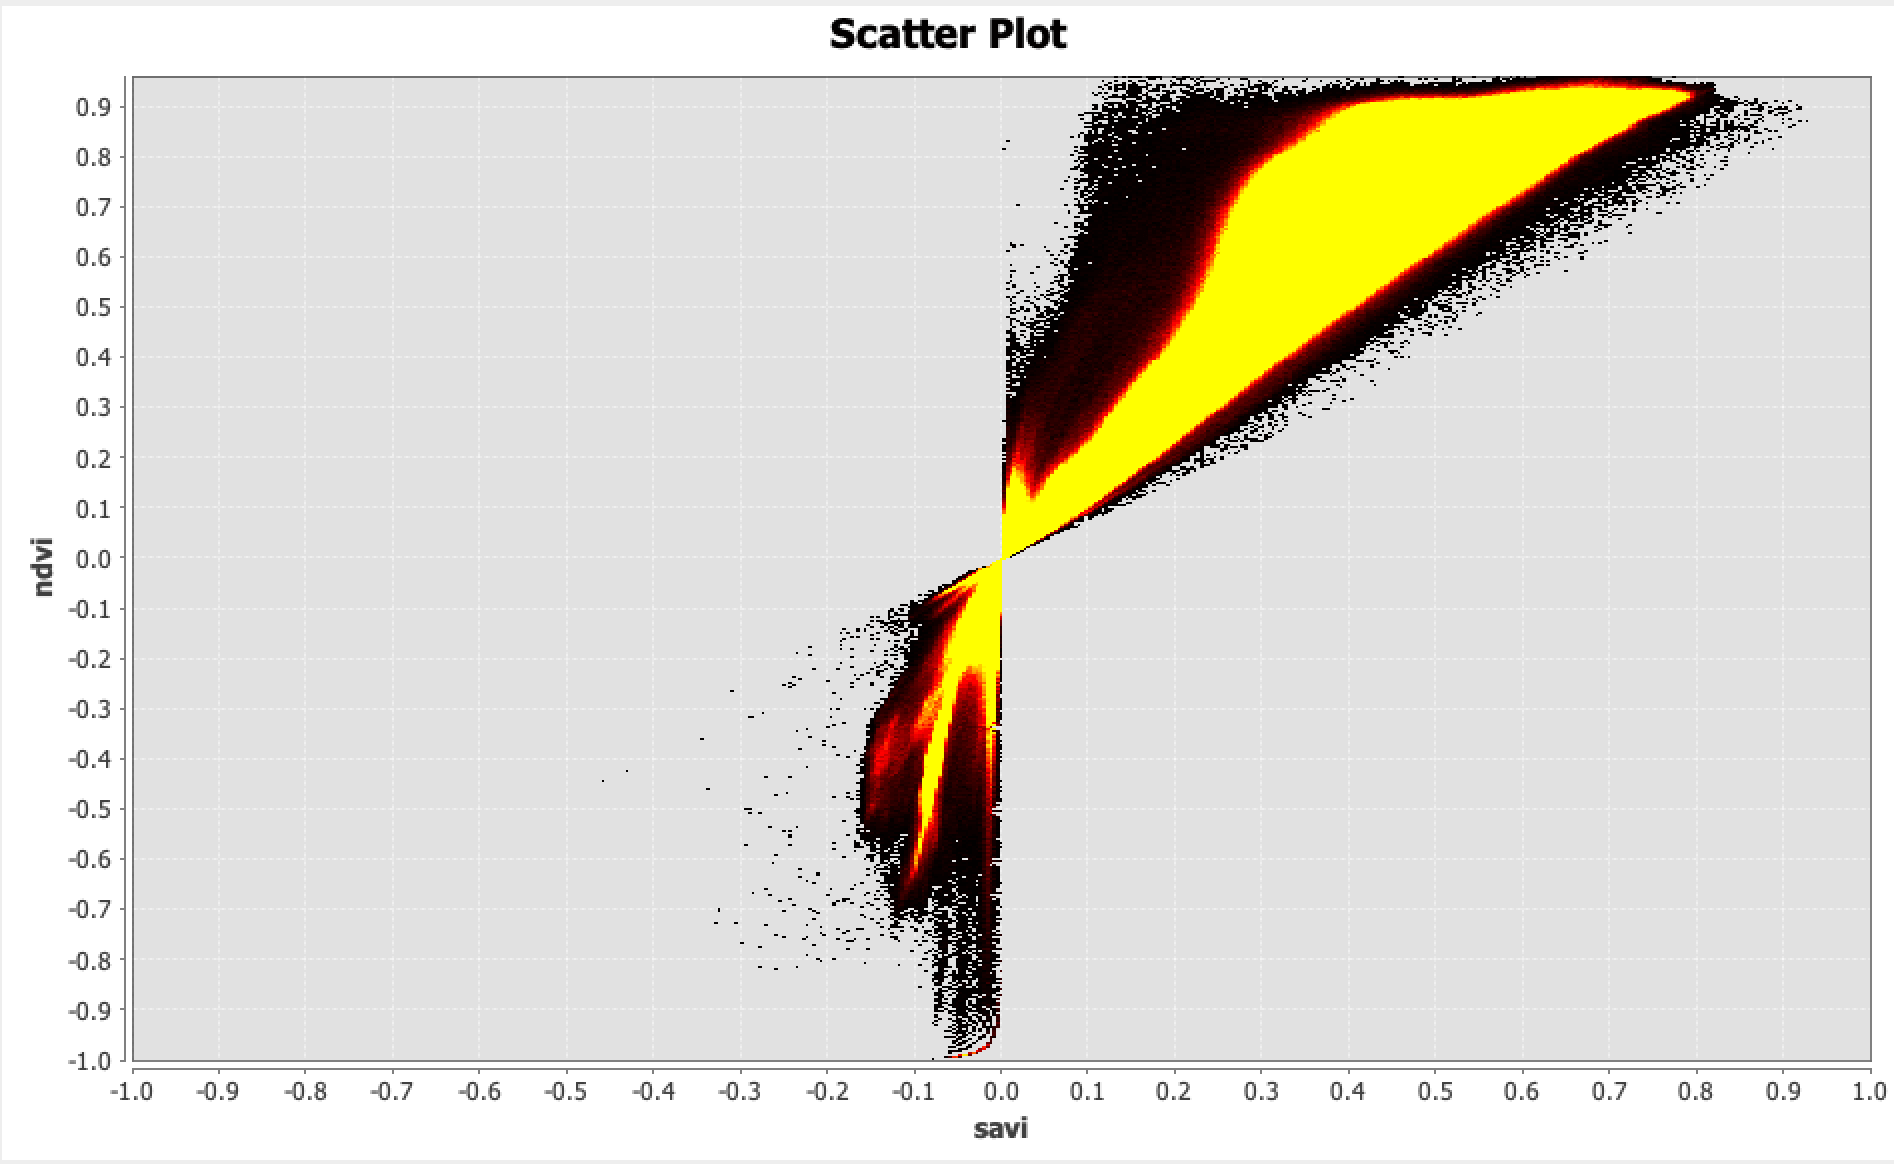
In the following screenshot you can see how to SAVI and NDVI are correlated. I created a scatter plot of the same region. In the x-axis I placed the SAVI values, while in the y-axis the corresponding NDVI values.

As you will notice, values differ significantly. NDVI values lower than 0.2 indicate no vegetation, just soil. Negative values are either water or urban areas. The higher the NDVI values (the same stands for SAVI) the denser (and more healthy) the vegetation. But NDVI start saturating after the value of 0.7, while SAVI at this point is only 0.3. This means that SAVI can be better used in dense vegetation because it saturates less fast. Although keep in mind that the L parameter needs to be adjusted when having more dense vegetation cover.
