
Oil spills detection and identification with Synthetic Aperture Radar (SAR)
How to detect and monitor oil spills from space?
In the last decades oil spill pollution is a matter of great concern since it affects the environment, economy, life cycle, the human food chain and as a result constitutes a crucial environmental and socio-economic problem. Oil spills can seriously damage beaches, marshlands and fragile marine ecosystems. This happens because oil-petroleum hydrocarbons contain many toxic compounds that cause huge damages in vegetation but in greater level to the Sea life [1].
Deliberately or accidentally oil spills often result in both immediate and long-term environmental damage. Some of the environmental damage caused by an oil spill can last for decades after the spill occurs. These damages caused by leakages from offshore drilling platforms during oil production, by accidents in connection with transportation, or by illegal releases from tankers etc. Once oil is released on the sea surface, it quickly spreads to form a thin layer on the water surface, known as oil slick. Oil slick becomes thinner and thinner forming a layer known as a sheen that looks like a rainbow. In addition light oils are quite toxic but evaporate very fast while heavy oils can get mixed with sandy beaches where they may remain for a long time [2]. Annually, 48% of the oil pollution in the oceans are fuels and 29% caused by crude oil. Tanker accidents contribute with only 5% of all pollution entering into the sea. According to the European Space Agency, 45% of the oil pollution comes from operative discharges from ships [3]. It has been estimated that 457,000 tones of oil are released by shipping into the ocean every year [4].
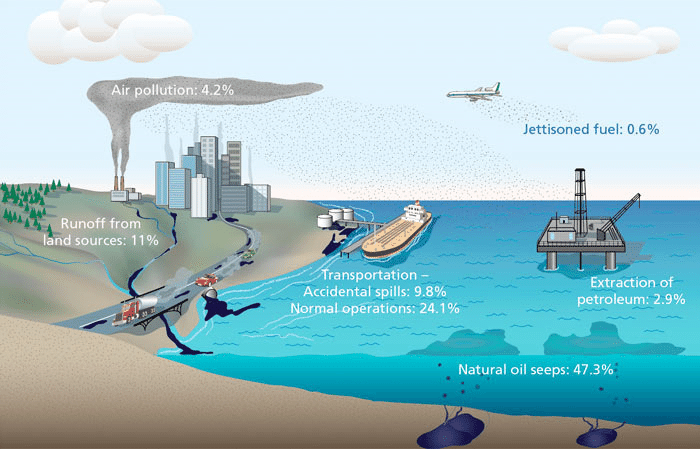
Figure 1 - Oil in the Ocean: A Complex Mix (Woods Hole Oceanographic Institution 2011)
Oil companies and shipping operators have the responsibility to control spilled oil and clean the polluted areas but unfortunately their actions about this issue are inconsequential. For the above aspects, there is a big effort by authorities around the world in order to prevent and limit the problem as much as they can by developing surveillance systems that can efficiently monitor oil spills on the sea surface. Monitoring can be divided into detection and identification [2]. Detection is the procedure, which is responsible to find-detect the oil spill in the image while identification is the process of the detected oil spill in order to classify-identify the oil spill according the oil type, thickness, etc. Actually oil spill detection and identification of them is a very difficult, challenging and actual task, which must be taken seriously into consideration because it is an important component of oil-spill disaster management. Monitoring of oil spills can be divided into ground, aerial and satellite observation.
Synthetic Aperture Radar (SAR) has entered into a successful period, while more than 10 spaceborne SAR sensors are being operated today such as RADARSAT-2, RISAT-2, HJ-1C [8], which are the main providers of satellite SAR images for oil spill monitoring, and 10 new SAR systems (NovaSAR-X) will be launched within next 5 years[9]. Spaceborne SAR sensors are extensively operated for the detection of oil spills in the marine environment, as they are independent from sun light, they are independent by cloudiness, they can cover quite large areas and are more cost-effective comparing to airborne monitoring systems. SAR is an active microwave sensor that has a unique imaging capability. It captures high spatial resolution two-dimensional images [5], with a side-looking imaging geometry and is based on a pulsed radar, which is installed on a platform with a forward movement [9]. Thus, it can be used as a tool to detect the possible location of an oil spill. SLAR (Side- Looking Airborne Radar) is another type of Radar, which can be used for oil spill detection and identification. SAR has superior spatial resolution and range than SLAR due to the fact that SLAR needs a quite big antenna to be installed in order to get high spatial resolution [2]. On the other hand, SLAR is less expensive and mainly used for airborne remote sensing while SAR sensors can be installed on both aircrafts and satellites [10].
Several spaceborne SAR systems have been used over the years for oil spill monitoring and they are described by their frequency band, polarization that refers to the geometry of the electromagnetic signal, the incidence angle, the swath width and the image resolution [5]. Incidence angle is the angular relationship between the radar beam and the ground target, while swath width is actually the distance, centered on the sensor path [11]. The swath width also varies in airborne or spaceborne cases from 20km to 500km. Frequency bands that are commonly used for SAR systems and more specifically for agriculture, ocean and ice monitoring are L, S, X and C-Band [9]. Furthermore there are four typical polarization combinations (HH, VV, HV and VH) where the first letter indicates the transmitted polarization and second one the received polarization [12]. Multi-polarization SAR sensors are quite new in SAR domain and have been used in order to improve the oil spill detection[11]. Dual-polarized (VV and HH) C-Band combination seems to be one of the most appropriate choices for oceans monitoring [11, 12]. Table 1 presents few satellites models with their basic characteristics, of the last two decades, that carrying SAR sensor and is commonly used for ocean monitoring.
Table 1 Satellites models [5]
Satellite (sensor) |
Band |
Resolution(m) |
Swath width (km) |
Incidence angle (°) |
|
ERS-2 |
C |
30 x 26.3 |
100 |
20 - 26 |
|
ENVISAT |
C |
30 x 30 |
100 |
15 - 45 |
|
RADARSAT-1 |
C |
50 x 50 |
300 |
20 - 46 |
|
TerraSAR-X |
X |
18.5 x 30 |
100 |
60 |
|
ALOS |
L |
14 x 88 |
70 |
8 - 60 |
|
Oil spill detection by SAR is a complex procedure that is described by several steps, which will be briefly explained below. Once the area of interest is chosen such as open sea, coastal zones etc. a plan is designed by an operator to get SAR data. Satellite acquires images from the selected area of concern and then these satellite’s data are received from the ground station. Pre-processing of data includes calibration, image cutting and georeferencing is the most time critical step [13]. The most crucial step is the oil spill detection in SAR image that can be described by three different approaches. The manual approach, which is carried out by experienced operators that are trained to analyze SAR images to detect oil spills [5]. Semi automatic and automatic are the other two approaches that are not very popular for oil spill detection because they are complex. In fully automatic method various algorithms are applied to detect oil spills and are usually divided into three sub-steps: dark spot detection i.e. identification of region of interest, features extraction and classification[3]. Dark formations and their detection are a long and analytical section, so wisely are briefly described in the next paragraph. Features are very important for the last sub-step (classification) because they are used as inputs to the classifier. They are also based on the geometry and shape of the selected area, on the backscatter values of the dark spot and there textural and contextual features. Several experiments have shown that textural features that are contained in SAR images are very useful of the analysis and classification of the image[14]. The purpose of the classifier is to identify the oil spill, which means that classifier follows a process in order to distinguish oil spills from other dark formations that are presented on the image. There are many different techniques that are commonly used for sake of the automatic approach and especially for the classification procedure, such as the Artificial Neural Network (ANN) [10], Wavelet Neural Network (WNN), Hybrid Polarimetric, [15] etc. The need for automatic algorithms is extremely high and depends on the number of images to be analyzed, but for monitoring large sea areas it is a cost-effective method comparing to the manual approach [3]. The last step of the cycle is to make the end user aware of current status for the decision making. Experienced technologists and experts carry out all stages, steps and approaches of the above described cycle [13].
As it mentioned above any dark formation that is detected on the image and is darker than the surrounding area, it will probably be an oil spill and needs classification methods to be applied to characterize them as oil spills or another object i.e. look-alike object [4]. Apart from oil spills dark formations can be oil spills, low wind areas, organic film, fronts, areas sheltered by land, rain cells, current shear zones, grease ice, internal waves, upwelling zones, down welling zones and eddies[16, 17]. If dark formations are not detected in this step they will never be identified. The reason why oil spills appear as dark areas in SAR images is that the oil dampens the capillary waves of the sea surface [7].
Although this procedure seems to be quite simple for a human specialist-operator (manual method) it includes few important difficulties for semi-automatic or fully automatic approach. At first fresh oil seems brighter on the image than the older oil spills. They have weak backscattering contrast comparing with the surrounding area and hence discrimination still being a challenging task. Furthermore dark formations can have various contrast values, depending on local sea state, oil type, image resolution and incidence angle. Last but not least the famous look-alike phenomenon which is also presented on the SAR image as a dark formation and it will briefly defined in later sections while it constitutes on of the most crucial limitations-difficulties in oil spills detection via SAR[14, 18]. Taking into account all the above, Synthetic Aperture Radar (SAR) can effectively be used for oil spills detection and identification but several meteorological phenomena and similar dark formations that may arise from a variety of reasons create many misidentifications. A complementation with other sensors it may give important and encouraging solutions.
The combined use of satellite-based synthetic aperture radar (SAR) images and aircraft surveillance flights is the most cost-effective way to monitor big areas and detect the source of the pollution (oil platforms, tankers, etc.). In overall comparison SAR is dominant because its capabilities for oil spill detection over the oceans are well known and proven even if it cannot combine all of its advantages[5, 6]. On the other hand there are several other sensors based on a different technologies, which can complement with a remarkable extent.
Optical sensors are based in a totally different technology and they can provide a quite good coverage like Terra/Aqua MODIS and ENVISAT MERIS, by imaging oil spills with high resolution but under certain weather conditions. UV technology can detect oil spills because spill displays highly reflectivity of UV radiation even at thin layers. Cloudiness, extreme weather conditions, and daytime operation, are the main disadvantages that can really affect detection and as a result the identification of oil spill [3, 6]. Nevertheless, sensors like UV and IR (infrared) can be easily mounted on aircraft and that makes operational use of these sensors convenient. Moreover, the cost and size of sensors can play a significant role in using sensors for oil spill surveillance. IR sensors are cheap and this has led to their widespread use for oil spill surveillance. Oil absorbs solar radiation and re-emits a portion of this energy as thermal energy. Also IR sensors observe thick oil slicks as hot, intermediate thickness of oil as cool, while thin oil is not possible to detect [2]. A combination of IR and UV can provide a more reliable indication of oil and can be used for oil thickness estimation. Apart from that, another way for oil thickness quantification is the microwave radiometer (MWR) [19]. Thickness is an important limitation-challenge for oil spill detection by SAR.
Advanced sensors such as laser fluorosensors are very costly but they can complement to SAR sensor because of their capability to classify oil, which is a difficult task for SAR. Fluorosensors can also provide further information about the type and amount of oil on various backgrounds including ice and shoreline[2, 19]. Oil can be classified into heavy, medium and light crude or refined oil. Once classified, it is easier to respond to the oil spill and to model the oil spill drift and spreading. Hyperspectral sensor is an effective solution for oil spill distinction due to the fact that can provide more than 200 wavelengths [3].
As it mentioned above, different remote sensing sensors with different technology and technique can highly complement to the oil spills detection with Synthetic Aperture Radar (SAR). Real sampling is something that can provide the most accurate information about oil spill type and thickness. Only vessels that are equipped with specialized radars can carry out this procedure and then they can provide these data (oil type, thickness) to several sensors for a perfect complementation. However they cannot cover large areas and are costly enough [20]
From this viewpoint it is worthwhile to mention that SAR faces many difficulties that can limit its operation, the effectiveness and accuracy of its result in oil spill detection and identification. These kinds of limitations can be placed in different categories.
The most common SAR sensors on board of operational satellites are using the C band. In this frequency winds can really affect SAR images because the wind level influences the backscatter level and the visibility of oil spills on the sea surface[20]. Oil spills are visible in the SAR image only for a limited range of wind speeds. Wind speed between 2-3 m/s creates sufficient brightness in the image and makes the oil visible while a wind speed between 12-14 m/s should probably be the upper limit for all spaceborne SAR monitors of oil spills [3]. From several experiments and surveys experts found that the maximum wind speed for oil spill detection depends on oil type and age of the spill. Not only wind speed but also wind direction can seriously create limitations to oil spill detection [10].
A SAR sensor is the most efficient satellite sensor for oil spill detection and identification, even though it cannot estimate oil spill thickness, oil type recognition and detect oil spills beneath ice without an extra help from other sensors [8]. Ice does not create problem only in oil spill detection but also identification.
Identification and discrimination of oil spill are similar significances beneath them the look-alike limitation-difficulty, the most popular problem in this concept. Look-alikes objects are mainly natural phenomena with specific characteristics that seem to be similar in a SAR image[5]. Look-alikes include natural films/slicks, algae, which can be misidentified as oil because algae has a similar effect to oil in dampening the radar backscatter signal [8], grease ice, rain cells, internal waves, shear zones etc. In Figure 2 an example of a look-like problem is provided.
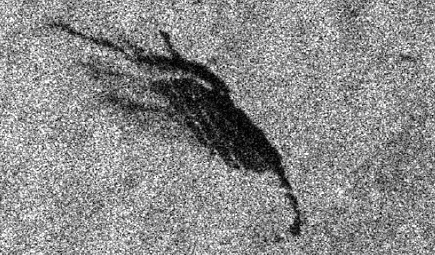
Figure 2 - Two examples of dark formations. Left: a verified oil spill on a SAR image. Right: a verified look-alike on a SAR image. Both taken on 2005 [5].
Speckle is another large problem in SAR images and its form looks like high frequency ‘’salt-and pepper’’ noise over the image [21].
Last but not least the coverage and revisit time constitute a hurdle in SAR efficiency. Since the spaceborne SAR has polar orbits, the coverage depends on the latitude. Coverage decreases with the distance from the poles, which means that is quite good in the Polar Regions. For example in the Mediterranean Sea the number of ERS’s pass per day is 0.04[3].
For the foreseeable future, there is a number of commercial SAR missions that have been already planned [3]. It seems to be an auspicious future with many challenges that SAR must overpass in order to achieve the highest level and offer more because SAR missions are crucial for sustainable operational oil spill detection and identification services. Table 2 provides information about upcoming missions (next 6 years).
Table 2 Satellites models.
Satellite |
Band |
Instrument |
Orbit |
Launching Year |
|
SAOCOM-1A |
L |
SAR-L |
06:00 asc |
2014 |
|
CSG-1 |
X |
SAR2000-S.G |
06:00 asc |
2015 |
|
RCM-1 |
C |
SAR RCM |
06:00 asc |
2018 |
|
RCM-2 |
C |
SAR RCM |
06:00 asc |
2018 |
|
BIOMASS |
P |
SAR-P |
06:00 |
2020 |
|
The above table shows that remote sensing is a scientific domain, which is developed rapidly. Oil spill detection with SAR Is an application of remote sensing and needs upgrades and has the need to surpass challenges such as discrimination between oil spill and look-alike. Automatic and semi automatic methods must be developed over the years as spatial resolution is upgraded. Also many techniques of SAR require significant computation however, computer improvements promise improved integration into future robust oil spill detection [1]. Polarimetric method is also a new technology that can really help in this scenario. All these suggest future multifrequency systems could discriminate thin sheens from thick, heavy oil slicks, although further research clearly is needed [15].
At present, it is commonly accepted from everyone that SAR is a key sensor and most likely the most effective choice for oil spill detection and identification. Several satellites are available that operate in the same manner as airborne and share their many limitations such as wind, look-alike objects, ice etc. Despite these limitations, which must be surpassed satellite platform equipped with a SAR sensor is the most useful and cost-effective option in order to monitor oil spills on the sea surface. It is a choice that promises a brilliant future with a variety of solutions.
[1] I. Leifer, W. J. Lehr, D. Simecek-Beatty, E. Bradley, R. Clark, P. Dennison, Y. Hu, S. Matheson, C. E. Jones, B. Holt, M. Reif, D. A. Roberts, J. Svejkovsky, G. Swayze and J. Wozencraft. State of the art satellite and airborne marine oil spill remote sensing: Application to the BP deepwater horizon oil spill. Remote Sens. Environ. 124(0), pp. 185-209. 2012.
[2] M. Jha, J. Levy and Y. Gao. Advances in remote sensing for oil spill disaster management: State-of-the-art sensors technology for oil spill surveillance. Sensors 8(1), pp. 236-255. 2008. Available: http://www.mdpi.com/1424-8220/8/1/236.
[3] C. Brekke and A. H. S. Solberg. Oil spill detection by satellite remote sensing. Remote Sens. Environ. 95(1), pp. 1-13. 2005.
[4] S. Singha, T. J. Bellerby and O. Trieschmann. Detection and classification of oil spill and look-alike spots from SAR imagery using an artificial neural network. IEEE International. 2012.
[5] K. Topouzelis. Oil spill detection by SAR images: Dark formation detection, feature extraction and classification algorithms. Sensors 8(10), pp. 6642-6659. 2008. Available: http://www.mdpi.com/1424-8220/8/10/6642.
[6] A. H. S. Solberg. Remote sensing of ocean oil-spill pollution. Proceedings of the IEEE 100(10), pp. 2931-2945. 2012.
[7] S. Skrunes, C. Brekke and T. Eltoft. Characterization of marine surface slicks by radarsat-2 multipolarization features. Geoscience and Remote Sensing, IEEE Transactions On 52(9), pp. 5302-5319. 2014.
[8] A. H. S. Solberg, C. Brekke and P. Ove Husoy. Oil spill detection in radarsat and envisat SAR images. Geoscience and Remote Sensing, IEEE Transactions On 45(3), pp. 746-755. 2007.
[9] A. Moreira, P. Prats-Iraola, M. Younis, G. Krieger, I. Hajnsek and K. P. Papathanassiou. A tutorial on synthetic aperture radar. Geoscience and Remote Sensing Magazine, IEEE 1(1), pp. 6-43. 2013.
[10] S. Singha, T. J. Bellerby and O. Trieschmann. Satellite oil spill detection using artificial neural networks. Selected Topics in Applied Earth Observations and Remote Sensing, IEEE Journal Of 6(6), pp. 2355-2363. 2013.
[11] A. -. Salberg, O. Rudjord and A. H. S. Solberg. Model based oil spill detection using polarimetric SAR. IEEE International. 2012, .
[12] M. Migliaccio, A. Gambardella and M. Tranfaglia. SAR polarimetry to observe oil spills. Geoscience and Remote Sensing, IEEE Transactions On 45(2), pp. 506-511. 2007.
[13] O. N. Gershenzon, V. E. Gershenzon and S. V. Osheyko. Integral solution for oil spill detection using SAR data. Presented at Recent Advances in Space Technologies, 2007. RAST '07. 3rd International Conference On. 2007, .
[14] Fengli Zhang, Yun Shao, Wei Tian and Shiang Wang. Oil spill identification based on textural information of SAR image. Presented at Geoscience and Remote Sensing, IGARSS 2008. IEEE International. 2008, .
[15] A. -. Salberg, O. Rudjord and A. H. S. Solberg. Oil spill detection in hybrid-polarimetric SAR images. Geoscience and Remote Sensing, IEEE Transactions On PP(99), pp. 1-13. 2014.
[16] H. A. Hovland, J. A. Johannessen and G. Digranes. Slick detection in SAR images. Presented at Geoscience and Remote Sensing Symposium, 1994. IGARSS '94. Surface and Atmospheric Remote Sensing: Technologies, Data Analysis and Interpretation., International. 1994, .
[17] W. Alpers, V. Wismann, R. Theis, H. Huhnerfuss, N. Bartsch, J. Moreira and J. D. Lyden. The damping of ocean surface waves by monomolecular sea slicks measured by airborne multi-frequency radars during the saxon-fpn experiment. Presented at Geoscience and Remote Sensing Symposium, 1991. IGARSS '91. Remote Sensing: Global Monitoring for Earth Management., International. 1991.
[18] R. Uiboupin, U. Raudsepp and L. Sipelgas. Detection of oil spills on SAR images, identification of polluters and forecast of the slicks trajectory. 2008 IEEE/OES. 2008.
[19] G. De Carolis, M. Adamo and G. Pasquariello. On the estimation of thickness of marine oil slicks from sun-glittered, near-infrared MERIS and MODIS imagery: The lebanon oil spill case study. Geoscience and Remote Sensing, IEEE Transactions On 52(1), pp. 559-573. 2014.
[20] K. Topouzelis, V. Karathanassi, P. Pavlakis and D. Rokos. Detection and discrimination between oil spills and look-alike phenomena through neural networks. ISPRS Journal of Photogrammetry and Remote Sensing 62(4), pp. 264-270. 2007.
[21] M.Zhou, H.Chen, J.Paisley, L.Ren, L.Li,“ Nonparametric Bayesian Dictionary Learning for Analysis of Noisy and Incomplete Images,” IEEE Transaction on Image processing, pp-1-16, June 2011.