
A gentle introduction to hyperspectral remote sensing
Remote Sensing has been identified as “the field of study associated with extracting information about an object without coming into physical contact with it”. In that regard, remote sensing sensors capture specific information from which decisions can be made. For example, a weather satellite can acquire remote sensing images and by proper algorithmic processing, atmospheric parameters can be derived, which ultimately can drive decisions. Often, the remote sensing sensors do not directly measure the particular information of interest, but simply record data from which the desired information can be extracted or correlated.
In a more technical sense, remote sensing refers to the set of technological instrumentation of recording the electromagnetic radiation emitted and/or reflected by the observed objects. The hyperspectral remote sensing is a specific sector of remote sensing, identified by the corresponding sensors used to capture data. In the mid 80’s, two distinct by that time technological areas converged; spectroscopy and remote sensing. This led to the development of “hyperspectral remote sensing” or “imaging spectroscopy”. The instrumentation produced is called hyperspectral sensors or imaging spectrometers. Before delving further into technical characteristics of the sensors, it is beneficial to present first the broader field of electro-optical and infrared remote sensing, along with the corresponding terminology.
The electromagnetic spectral region observed by hyperspectral sensors is a small portion of the full spectrum; usually it ranges from 0.4 to 2.5 μm. The fact that these sensors are sensitive in this portion of the spectrum, lays with the atmospheric conditions of our planet (Figure below). The atmosphere allows (transmitted) and blocks (absorbed) specific ranges of wavelengths. The transmitted wavelengths reach the Earth surface and are reflected by it. The hyperspectral sensors record the reflected radiation.
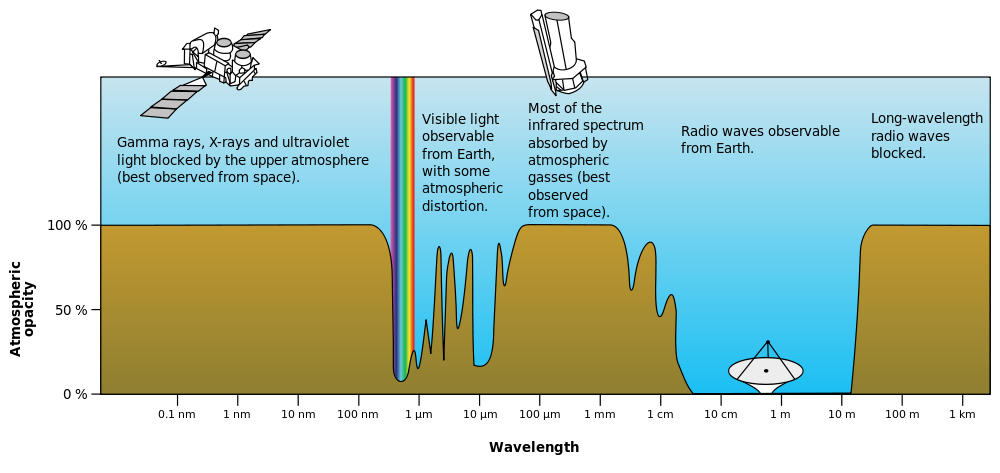 Earth’s Atmospheric Opacity
The different materials/objects reflect and emit the electromagnetic radiation in varying proportions. The reflected light from the surface interacts in a unique way for each material/object and even slight variations of it are quantified and recorded through hyperspectral imagery. The result of this light-to-object interaction is called spectral signature and is considered as the spectral “fingerprint” of each object. Most of the methods and techniques in hyperspectral remote sensing are based purely on the detailed spectral signatures that the imaging spectrometers record.
The data recorded from hyperspectral sensors have a 3-dimensional structure, also called data cube or simply cube. The first 2 dimensions are the spatial ones (Figure below), while the third dimension is the spectral dimension. Each spatial pixel is a vector (pixel column or pixel vector) containing the spectral information, i.e. values of reflected radiance or reflectance (Figure below). If we select a pixel vector and plot its values as a function of the corresponding wavelengths, the result will be the average spectral signature of all materials and objects covered in the ground area of the pixel.
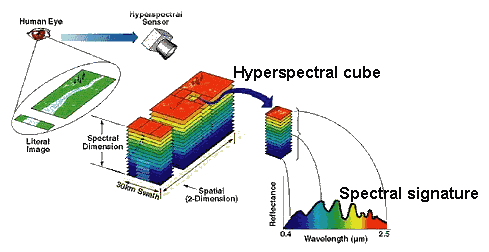
Hyperspectral cube and pixel Spectral Signature
About the writer
Related article for further reading
There are numerous methods and techniques to extract information from a hyperspectral image (HSI). By taking into account the complexity of the data as well as, the different objectives of each application, there is not a single information extraction technique that outperforms all others in every practical situation.
