Glacier Mapping using Earth Observation Satellites
Learn how to map glaciers and snow cover with Sentinel-2 and SNAP
Presently, 10 percent of land area on Earth is covered with glacial ice, including glaciers, ice caps, and the ice sheets of Greenland and Antarctica. Of course due to climate change this percentage decrease unfortunately. Areas filled with glaciers cover over 15 million square kilometers, while they store about 75 percent of the world’s fresh water.
Glaciers are an essential part of our living environment and especially the cryosphere. Although not everybody is familiar with glaciers, they are considered as very important natural regions that need to be preserved and monitored. Scientists analyzing glaciers can better model and understand the climate and it’s changes and dive into earth’s long forgotten climate history!
Remote sensing images acquired from different platforms (satellite, aircraft) using sensors that operate in different spectral regions (visible, infrared, microwave) have been widely used to study glaciers, e.g. to measure ice thickness, surface ice velocities, and changes in surface elevation over time. Remote sensing techniques have been used for spectral characterisation of different snow and icefaces, preliminary inventory of glaciers including aerial extent and position of large crevasses, and for mapping and monitoring glacial variations especially at the glacier margins and terminus location.
The images below are different time stamps of the same area. In the left you have the natural colour (as you would see it with you own eyes) and in the right you see the result of an index called NDGI (Normalized Difference Glacier Index).
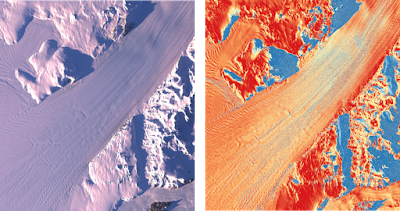
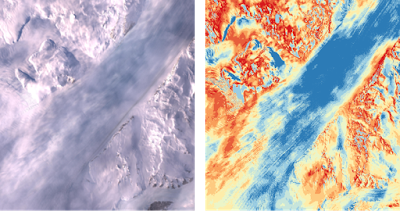
Multi-temporal Sentinel 2 imagery data allow the terminus and area mapping of glaciers as well as the study of the spectral characteristics of snow and ice in the spatial resolution of 10 m — 20 m.
Free
Regular price

Lesson 1: Introduction to the course
Lesson 2: Electromagnetic Radiation Basics
Lesson 3: How Snow interacts with Visible and NIR Radiation?
Lesson 4: How Snow interacts with Thermal Radiation?
Lesson 5: How Snow interacts with Microwave Radiation?
Quiz 1
Lesson 6: Earth Observation Workflows
Lesson 7: ESA SNAP Graphical Processing Tool (GPT)
Lesson 8: ESA SNAP Graph Builder
Lesson 9: Band Math and SNAP GPT
Quiz 2
Lesson 10: Glacier and Snow Mapping Methods
Lesson 11: Spectral Index Mapping Method
Download Spectral Index Mapping Method
Lesson 12: Principal Component Analysis Mapping Method
Download PCA Mapping Method
Quiz 3
glacier mapping using remote sensing
Sentinel-2 processing to map Glaciers and Snow Cover
ESA SNAP Graph Builder Tool
ESA SNAP GPT
Learn how electromagnetic radiation interacts with snow
Basic knowledge of Earth Observation
Be familiar with ESA Sentinels Application Platform (SNAP) software
A simple laptop or desktop computer to follow the course's steps
Under/post graduate students
Professionals and Companies
Master students and PhD candidates
Researchers and Academics
Free
Enroll NowFree
Enroll NowFree
Enroll Now